Anti‑sedentary campaign
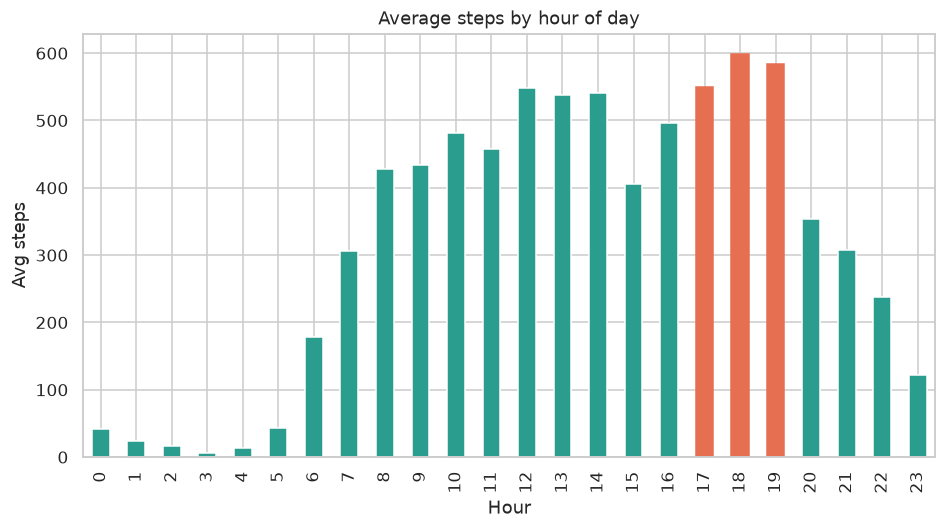
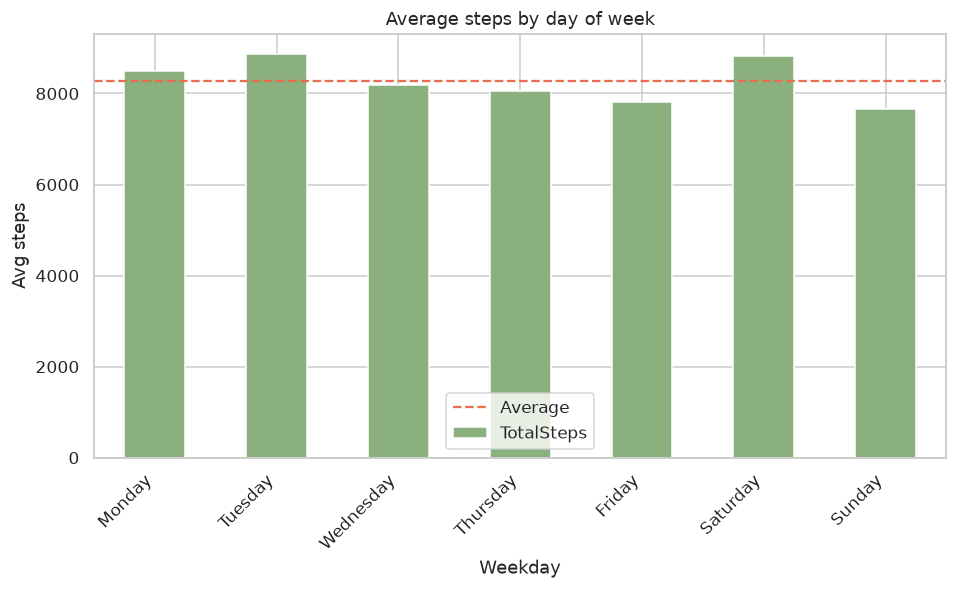
Position Bellabeat as the app that gets you moving: smart reminders in the peak windows (12–2pm, 5–7pm) and realistic goals such as +1,000 steps/day.
Data Analytics Case Study
Analyzing fitness smart‑device data to shape the marketing strategy of Bellabeat, a high‑tech wellness brand for women.
01 — Ask
As a junior data analyst on Bellabeat's marketing team, the goal was to analyze how consumers use non‑Bellabeat smart devices and translate the trends into concrete marketing recommendations for a Bellabeat product.
“An analysis of available consumer data would reveal more opportunities for growth.”
— Urška Sršen, Bellabeat cofounder & CCO02 — Prepare
Source: FitBit Fitness Tracker Data (Kaggle, CC0 Public Domain) — minute‑level activity, sleep and heart‑rate logs from 33 users, Apr 12 – May 12, 2016.
Methodology
Define the business task and stakeholders before touching the data.
Source the data, assess credibility (ROCCC) and document its limits.
Clean in Python: drop duplicates, parse dates, isolate non‑wear days.
Summary stats, correlations, usage segmentation and time patterns.
Six brand‑aligned visualizations that communicate the key findings.
Translate the insights into three concrete marketing recommendations.
04 — Analyze · 05 — Share
06 — Act
Chosen product: the Bellabeat app (with a focus on the Leaf / Time tracker).
Position Bellabeat as the app that gets you moving: smart reminders in the peak windows (12–2pm, 5–7pm) and realistic goals such as +1,000 steps/day.
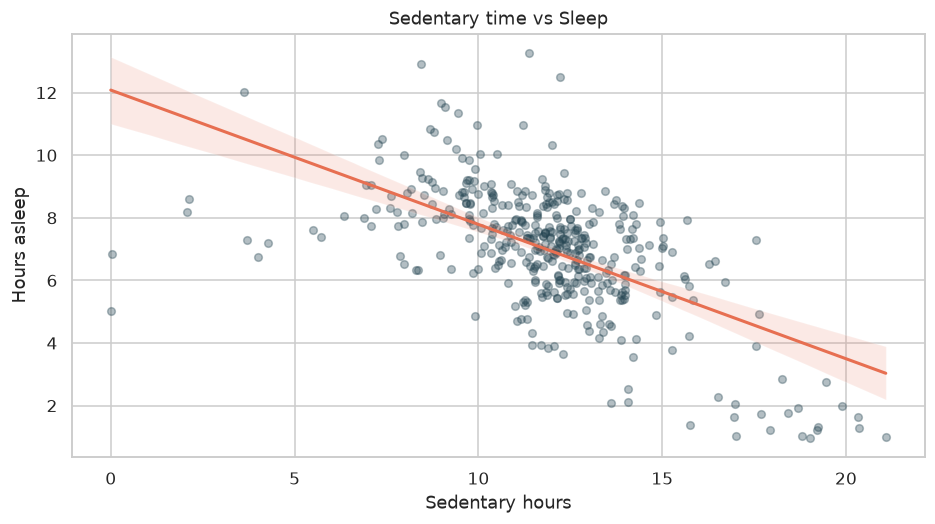
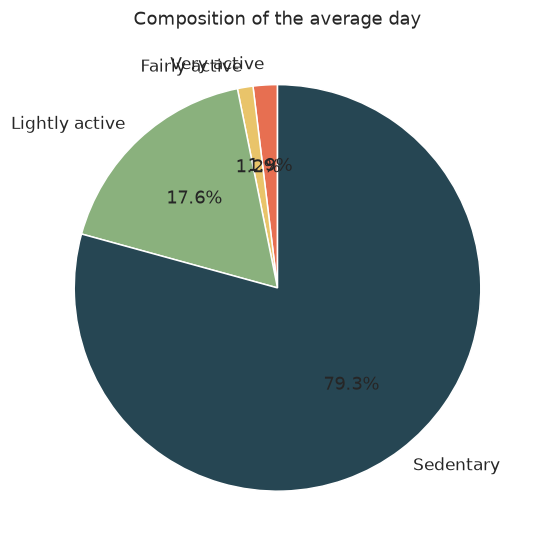
Only 24/33 users track sleep, yet it links to sedentary time. Communicate “move by day, sleep better at night” — an ideal lever for premium membership.
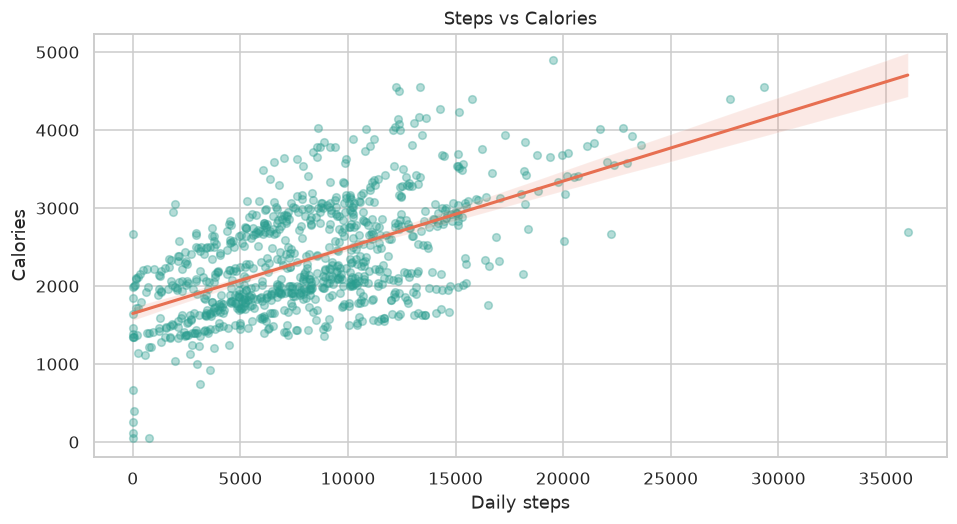
Send content at peak‑usage times and gamify the steps→calories feedback with badges and streaks to boost retention and upsell.
Deliverables
The complete, reproducible analysis is available in multiple formats — in English and Italian.